In the world of ham radio, every contact (QSO) tells a story—of signal propagation, atmospheric conditions, and, sometimes, antenna alignment quirks. While most hams are well-versed in optimizing transmit paths, the reverse path often gets less attention. But here’s the thing: for every successful two-way communication, what gets sent must also come back—and if your antenna isn’t properly oriented for that return trip, you could be missing out on cleaner, stronger signals.
So, let’s break down what reverse path antenna orientation really means for amateur radio operators—and how it can improve your operating experience.
What Is Reverse Path Antenna Orientation?
Think of reverse path antenna orientation as paying attention to how your antenna hears, not just how it transmits.
In a typical QSO, your antenna transmits a signal to a distant station. That station, of course, transmits back to you on the same or a different frequency (depending on mode and band). If your antenna is directional—like a Yagi, quad, or even a rotatable dipole—its physical orientation will affect how well it receives signals from that station’s direction. That’s your reverse path.
In essence:
“Your signal may be getting out fine, but are you listening in the right direction?”
Why Reverse Path Orientation Is Crucial in Ham Radio
Many hams are surprised to find that they can be heard five-nine but are barely pulling in the return signal. If you’re running a directional antenna and not thinking about your receive path, here’s what could be happening:
1. Directional Imbalance
You’re pointed toward your target when transmitting, but not necessarily maximizing reception if conditions favor a different return angle—especially on HF bands where ionospheric skip can cause inbound signals to arrive from an unexpected direction.
2. Polarization Mismatch
On VHF and UHF, especially with horizontal vs. vertical polarization differences, your antenna’s receive sensitivity can be greatly reduced on the return path if it’s not matched properly with the transmitting station’s orientation.
3. Asymmetric Propagation
Especially on bands like 10m or 6m, propagation can vary dramatically minute-to-minute. The reverse path may favor a different skip zone or reflect differently off the ionosphere—requiring small adjustments for best reception.
4. Local Obstructions or Noise
If one side of your antenna’s pattern faces toward a power line, building, or RF noise source, your receive quality can tank even though your transmit signal is fine.
How to Optimize Reverse Path Performance
Here are a few things you can do to make sure your station hears as well as it talks:
Use a rotator and pay attention to both ends of the QSO. After you get your report, ask the other station where they’re hearing you from—then tweak your orientation as needed.
Try switching antennas for receive. Many hams use a separate receive antenna (like a loop or beverage antenna) especially on low bands (80m, 160m) where noise or directionality can be a challenge.
Play with polarity on VHF/UHF. If you’re working simplex or weak-signal work, try rotating your beam 90° to see if the signal comes up.
Use tools like reverse beacon networks or PSK Reporter. These can give you insight into how well your signal is getting out—and from where others are hearing you.
Log signal direction for both RX and TX. This helps you track propagation changes and can inform better orientation during contests or nets.
Real-World Example
Imagine you’re working 20 meters and calling a station in South Africa. You’re pointed southeast. They give you a solid signal report, but you’re struggling to copy their reply. By swinging your beam a few degrees east, or even slightly north, you find a sweet spot where their signal peaks—maybe due to a different ionospheric reflection on their end. That small adjustment just improved your receive path and made the QSO solid.
Final Thoughts
In ham radio, we often obsess over our “signal getting out,” but it’s equally important to listen smarter. Reverse path antenna orientation is a subtle but powerful concept that can help you dig weaker stations out of the noise, improve contest scores, and get more enjoyment from the hobby.
So next time the bands are open, don’t just transmit—tune, turn, and truly listen. That elusive DX might already be calling you back… you just need to be pointed in the right direction.
For decades, a peculiar and enigmatic phenomenon has captured the curiosity of amateur radio enthusiasts, conspiracy theorists, and cryptographers alike: numbers stations. These mysterious broadcasts, often featuring robotic or human voices reading sequences of numbers, letters, or coded words, have been a persistent enigma on the shortwave radio spectrum. But what exactly are numbers stations, and why do they continue to baffle experts and hobbyists?
What Are Numbers Stations?
Numbers stations are shortwave radio transmissions that broadcast seemingly random sequences of numbers, letters, or sounds. These broadcasts often feature a monotone voice (human or synthetic) reading the sequences. Sometimes, they are preceded by distinctive sounds, such as musical tones, beeps, or even nursery rhymes.
These stations have been documented as far back as World War I, with their heyday during the Cold War era. Despite technological advancements in secure digital communication, some numbers stations are still active today, continuing to intrigue listeners worldwide.
The Purpose Behind the Broadcasts
The general consensus among experts is that numbers stations are used for espionage. Governments and intelligence agencies allegedly use them to send encrypted messages to operatives in the field. The key advantage of using shortwave radio is its ability to transmit over vast distances, reaching remote corners of the globe.
The system works through a technique known as a one-time pad cipher. The operative receives a pre-shared, unbreakable codebook (the “pad”), which is used to decode the seemingly random numbers into actionable instructions. Without the pad, the code is nearly impossible to crack, ensuring the utmost secrecy.
Examples of Notable Numbers Stations
The Lincolnshire Poacher: One of the most famous numbers stations, this British station, active until 2008, was named after the English folk song that played as its interval signal. It broadcast sequences of numbers read by a female voice, believed to be operated by the UK’s MI6.
UVB-76 (The Buzzer): Operating from Russia, UVB-76 is notorious for its continuous buzzing sound, occasionally interrupted by a Russian voice reading coded messages. It’s still active today, sparking countless theories about its purpose.
E03 “The Count”: This American numbers station featured a male voice with an American accent, broadcasting numbers preceded by the phrase “Ready, Ready.” Its use faded in the 1990s.
The Allure of Numbers Stations
Part of the allure of numbers stations lies in their unchanging, analog nature in an increasingly digital world. Shortwave radio hobbyists often scan the bands, hoping to stumble upon these ghostly transmissions. Many record the broadcasts and share them online, fueling speculation and discussion in forums and communities.
Numbers stations also hold a place in popular culture. They’ve appeared in movies like The Numbers Station (2013), video games like Call of Duty: Black Ops, and TV shows like Lost, amplifying their mystique and appeal.
Are Numbers Stations Still Relevant?
With modern encryption and digital communication, numbers stations may seem obsolete. However, their continued presence suggests otherwise. Analog signals are harder to trace and intercept compared to digital ones, making shortwave radio an effective tool for clandestine operations. Additionally, their simplicity ensures reliability in situations where digital communication might fail.
Conclusion
Numbers stations remain a fascinating blend of history, mystery, and technology. Whether remnants of Cold War espionage or active tools of modern intelligence, their cryptic broadcasts continue to captivate and confound. For anyone with a shortwave radio and a bit of patience, the eerie world of numbers stations awaits exploration—a ghostly echo of an analog age that refuses to fade into obscurity.
Amateur radio, often referred to as “ham radio,” has long been a platform for experimentation, communication, and community building. While traditional voice and Morse code communications still hold a cherished place, the integration of digital platforms has revolutionized the ham radio experience. These platforms leverage modern technology to provide enhanced communication capabilities, allowing amateurs to connect more efficiently and creatively.
What Are Digital Platforms in Amateur Radio?
Digital platforms in amateur radio involve transmitting data using digital modes rather than traditional analog methods. These modes encode information such as text, images, or even files into a digital signal that can be transmitted over radio frequencies. At the receiving end, specialized software decodes the signal back into its original form.
Popular digital platforms include:
FT8: A highly efficient, low-bandwidth communication mode ideal for weak signal environments.
PSK31: A real-time keyboard-to-keyboard chat mode known for its simplicity and effectiveness in low-power operations.
JT65: Designed for weak signal communication, often used in moonbounce (EME) operations.
APRS (Automatic Packet Reporting System): A digital system used for real-time communication of information like location, weather, and messages.
DRM (Digital Radio Mondiale): A platform for transmitting high-quality digital audio and data.
C4FM(Continuous Four-Level Frequency Modulation) is a digital communication protocol widely used in amateur radio systems, particularly in the Yaesu System Fusion platform. Developed by Yaesu, C4FM is designed to enhance voice clarity and data transmission reliability in digital radio communication, catering to both amateur and professional radio operators.
Key Features of C4FM
High Voice Quality: C4FM is known for its superior voice quality, achieved through advanced error correction and efficient encoding techniques. This makes it ideal for clear communication even in challenging signal conditions.
Multiple Modes: C4FM supports various communication modes:
Voice FR (Full Rate): Provides high-quality digital voice transmission.
Voice + Data: Allows simultaneous transmission of voice and low-rate data (e.g., GPS information or text messages).
Data FR (Full Rate): Enables high-speed data transfer, which is particularly useful for sending images or larger data packets.
Analog FM Compatibility: Ensures backward compatibility with traditional analog FM systems, allowing seamless integration with older equipment.
Automatic Mode Select (AMS): Radios using C4FM often feature AMS, which automatically detects and switches between digital and analog signals. This ensures smooth communication regardless of the mode being used by the transmitting station.
Integration with Yaesu System Fusion: C4FM is a cornerstone of the Yaesu System Fusion digital communication system. This platform integrates C4FM with features like WiRES-X (Wide-coverage Internet Repeater Enhancement System), enabling global communication through linked repeaters and nodes.
Efficient Spectrum Utilization: C4FM’s design optimizes spectrum use, making it suitable for congested frequency bands. Its robust error correction ensures reliable communication, even in areas with weak signals.
Applications of C4FM
Amateur Radio: C4FM is popular among ham radio enthusiasts for its flexibility and high-quality performance. It supports both casual communication and emergency operations.
Public Safety: The protocol’s reliability and clarity make it valuable for first responders and other public safety professionals.
Data Communication: The ability to transmit GPS data, text messages, and images extends its use beyond voice communication.
Advantages of C4FM
High-quality audio with minimal distortion.
Compatibility with analog systems for easier transition to digital.
Flexible modes for voice and data transmission.
Robust performance in varying signal conditions.
Challenges
Despite its advantages, C4FM faces competition from other digital radio protocols like DMR (Digital Mobile Radio) and D-STAR. Each protocol has its strengths, and the choice often depends on user preferences and the availability of compatible infrastructure.
In conclusion, C4FM is a versatile and user-friendly digital communication platform that continues to gain popularity among amateur radio operators and professionals alike. Its blend of quality, reliability, and flexibility ensures its relevance in the evolving landscape of digital radio technology.
Key Components of Digital Platforms
To use digital modes, operators need several key components:
Transceiver: The radio equipment capable of transmitting and receiving signals.
Computer or Mobile Device: Used to run software for encoding and decoding digital signals.
Interface: Connects the transceiver to the computer, often including sound cards or USB adapters.
Software: Applications like WSJT-X, FLDIGI, and APRSISCE/32 are popular choices for digital mode operations.
Benefits of Digital Platforms
Digital platforms offer several advantages over traditional methods:
Efficiency: Modes like FT8 and JT65 enable reliable communication in low-power and noisy conditions.
Versatility: Digital modes can transmit a variety of data types, including text, images, and telemetry.
Global Reach: Internet-linked systems like D-STAR and EchoLink extend the reach of amateur radio, connecting operators worldwide without reliance on propagation conditions.
Experimentation: Digital platforms provide an opportunity for amateurs to explore cutting-edge technologies and develop innovative applications.
Challenges and Learning Curve
While digital platforms open new horizons, they also introduce challenges. Setting up and configuring hardware and software can be daunting for beginners. Additionally, operators must learn the protocols and practices specific to each digital mode. However, the amateur radio community offers extensive resources, forums, and local clubs to assist newcomers.
The Future of Amateur Radio Digital Platforms
The future of amateur radio is likely to see even greater integration of digital technologies. Advancements in software-defined radios (SDRs), machine learning, and digital signal processing promise to further enhance the capabilities and accessibility of ham radio. Furthermore, the use of digital modes in emergency communications and disaster response demonstrates their practical importance beyond hobbyist applications.
Conclusion
Digital platforms have transformed amateur radio, merging its rich tradition with the innovations of the digital age. By adopting these technologies, ham radio operators can expand their horizons, connect with more people, and continue to play a vital role in advancing communication technology. Whether you’re a seasoned operator or a curious beginner, the world of digital amateur radio awaits exploration
The 900 MHz band is part of the UHF (Ultra High Frequency) spectrum and spans 902–928 MHz in the United States. This band is allocated as an ISM (Industrial, Scientific, and Medical) band but is also shared with amateur radio on a secondary basis. Here’s an overview of its role in amateur radio:
Characteristics of the 900 MHz Band
Propagation:
The 900 MHz band behaves similarly to other UHF frequencies but offers slightly higher attenuation due to its shorter wavelength.
Signals are primarily line-of-sight and can penetrate buildings better than higher frequencies like 1.2 GHz but less effectively than VHF.
Bandwidth:
The band offers a wide 26 MHz of spectrum, allowing for high-speed data applications, experimentation, and voice communications.
Shared Use:
As a shared band, amateur radio operators must avoid interfering with primary users like ISM equipment, which includes devices like cordless phones, Wi-Fi, and industrial systems.
Applications in Amateur Radio
Repeater Systems:
900 MHz is increasingly used for amateur radio repeaters, providing coverage in urban areas. These repeaters often require specialized equipment, as commercial 900 MHz devices may need modification for amateur use.
Digital Modes:
Modes such as D-STAR, DMR, and P25 can operate in the 900 MHz range, enabling digital voice and data communication.
Mesh Networking:
Amateur radio operators use the 900 MHz band for HSMM (High-Speed Multimedia Mesh) networks, leveraging it for broadband-like applications.
Experimental Projects:
The band is popular for experimentation, including SDR (Software-Defined Radio), microwave link tests, and innovative antenna designs.
Equipment for the 900 MHz Band
Amateur radio equipment for this band is less common than for lower bands like VHF or HF.
Operators often repurpose commercial gear such as Motorola radios or modify ISM-band transceivers for amateur use.
SDR platforms like HackRF or BladeRF also support the 900 MHz band, making it accessible for tech-savvy operators.
Challenges and Considerations
Interference:
The proliferation of ISM devices in the 900 MHz band can lead to interference, especially in densely populated areas.
Limited Availability:
Off-the-shelf amateur radio gear for this band is relatively rare, requiring technical skills to adapt commercial equipment.
Regulations:
Amateur radio use in this band is secondary, meaning operators must yield to primary users and comply with specific regulations.
Why Use the 900 MHz Band?
The 900 MHz band provides a unique opportunity for experimentation and communication in areas where lower bands might be congested. Its characteristics make it suitable for both voice and data applications, particularly in urban and suburban environments.
As technology evolves, the 900 MHz band is gaining popularity among amateurs who enjoy the challenge of working with higher frequencies and less conventional equipment.
Association News
IRLP and 900 MHz Repeater: Check out the new page re our connection to the Internet Radio Linking Project, our 900 MHz repeater and associated links.
The rules and regulations in this part are designed to provide an amateur radio service having a fundamental purpose as expressed in the following principles:
(a) Recognition and enhancement of the value of the amateur service to the public as a voluntary noncommercial communication service, particularly with respect to providing emergency communications.
(b) Continuation and extension of the amateur’s proven ability to contribute to the advancement of the radio art.
(c) Encouragement and improvement of the amateur service through rules which provide for advancing skills in both the communication and technical phases of the art.
(d) Expansion of the existing reservoir within the amateur radio service of trained operators, technicians, and electronics experts.
(e) Continuation and extension of the amateur’s unique ability to enhance international goodwill.
In 2003, a study was done by a Jewish doctor, Heidi Yellen, on the frequencies of fabric. According to this study, the human body has a signature frequency of 100, and organic cotton is the same – 100. The study showed that if the number is lower than 100, it puts a strain on the body. A diseased, nearly dead person has a frequency of about 15, and that is where polyester, rayon, and silk register. Nonorganic cotton registers a signature frequency of about 70. However, if the fabric has a higher frequency, it gives energy to the body. This is where linen comes in as a super-fabric. Its frequency is 5,000. Wool is also 5,000, but when mixed together with linen, the frequencies cancel each other out and fall to zero. Even wearing a wool sweater on top of a linen outfit in a study collapsed the electrical field. The reason for this could be that the energy field of wool flows from left to right, while that of linen flows in the opposite direction, from right to left.
In an email dated 2/10/12, Dr. Yellen explained the process of this study: “Frequency was determined by a technician named Ivanne Farr who used a digital instrument designed by a retired Texas A&M professor called the Ag-Environ machine. We had a public demonstration with an audience at internationally known artist Bob Summers home.
“Bob Graham, the inventor, told us that his machine was created to analyze the signature frequencies of agricultural commodities to aid the farmer in determining the right time of harvest growth. The gentleman identified signature frequencies that identified illness also and had turned to helping people get well. Bob Graham stated that it was a ‘signature frequency of that plant’s species identity.’ The mHz is different, we were suggested that it would be the same as Rose essential oil.
“There could be better devices so we have been looking around for more options. There’s a device that a brilliant American agriculture scientist developed that does measure the frequency of Linen. We have not yet acquired one but hope to soon!
“Dr. Philip Callahan, a noted physician and researcher, was able to prove the existence of this energy using plant leaves attached to an oscilloscope. About six months ago, he visited me in California and showed me a new development. He had discovered that flax cloth, as suggested in the Books of Moses [the Torah or Pentatuch], acts as an antenna for the energy. He found that when the pure flax cloth was put over a wound or local pain, it greatly accelerated the healing process. He was also using the flax seed cloth as a sophisticated antenna for his oscilloscope. This is the instrument that he uses to determine energy of flax.”
Pgs. 19-20 of Whole Health, by Mark Mincolla Ph.D.
There are matching tools available to calculate and design an impedance matching circuit in moments. One example is provided by Analog devices Inc.’s online design center tool RF Impedance Matching Calculator.
Another online tool that is helpful is the Telestrian Interactive Smith Chart. It doesn’t do the design for you, but it shows you the effects of adding matching components. You can plug in the load impedance, set the series matching components to a short circuit and the parallel components to an open and it shows you where your impedance lies on the Smith chart. You can then add your matching components to view how the impedance point moves on the chart.
I was curious though, what’s the magic behind these tools? Sometimes it helps to know, for when things go awry. This section describes the procedure that I worked out should I ever have to “do it myself”.
My approach here is to try to limit this discussion to what MUST be done and WHY I am doing it. I’m trying to keep it simple with enough information to recall what I was thinking at the time, so I can do it again when I want to.
A basic understanding of resistance, reactance, (resistors, inductors and capacitors) and the Smith chart is required. For learning about the Smith chart, I highly recommend Basics of the Smith Chart, Alan Wolke’s (W2AEW) online presentation. This is the first time I’ve actually used a Smith Chart for a practical application so, I’m certainly not an expert. It might be helpful though to follow me here to see how I finally got it to work for me.
Objective
I have a Radio Transceiver designed to operate with a 50-ohm antenna (load) impedance. I want to match my antenna (load) impedance to the Radio (source) impedance. Why? The match is needed so that the Transmit signal does not reflect back from the load to the source AND when I receive a signal, I don’t want the signal to reflect back up the antenna. Reflections are bad because they return the RF signal to the radio (or antenna) reducing the power for the antenna to radiate (or the radio to receive). In the transmit case it could also damage the radio if the reflected power exceeds the radio’s ability to dissipate the energy. If we match the source and load impedances, we won’t have reflections, so all of the power will be radiated (or received). When matched(equal) their ratio will be 1:1 of course. This is our goal; it is referred to as a Voltage Standing Wave Ratio (VSWR). We want this to be 1.
Objective – > VSWR = 1.0
Antenna Impedance
The antenna has impedance to signal flow. The impedance is due to its resistance, inductance and capacitance. These are the three components that we need to know about to describe what is impeding the signal flow. The resistance (R) is kept very low by using conductors that are large enough to avoid dissipating heat energy. Resistance is NOT dependent on frequency. The inductance and capacitance also impede the signal flow. This impedance IS frequency dependent, it’s called reactance, designated by X. Reactance depends on the geometry of the antenna, where you are connected to it, and how it sits in the electric and magnetic fields that it generates and that exist around it (from things like the earth and other conductors). The geometries of the conductors effectively create inductors and capacitors, just like the components we can buy. Because their impedance is frequency dependent, as we transmit or try to receive signals of different frequencies this impedance changes as well. So, if we want the antenna to work well (limited signal loss due to reflections) we need to design matching circuits for the frequency ranges we plan on using. Because of this frequency dependence, we need to measure and track this impedance separately from resistance. Since frequency is the common factor for both inductor and capacitor impedance, we can combine them into a single reactance term (X). The resulting equation to describe impedance is:
Impedance equation Z = R + jX Where R (resistance) is NOT frequency dependent and X (reactance) IS frequency dependent.
Impedance (Z) and Admittance (Y = 1/Z)
So, we have impedance that can be described by physical passive components (resistors, inductors and capacitors). What is Admittance and why do we need it? Admittance is described by the equation G +jB, where G is the conductance (1/R – frequency independent) and B is the susceptance (1/X- frequency dependent). Do we have passive components that can conduct? And, what is susceptance? It turns out that when we add any of the three passive components in parallel to the load, instead of in series, the circuit will conduct more current and it is more susceptible to passing the frequency dependent current (AC). We need to know about admittance because it gives us a way to describe what happens when we add components in parallel to the load, and even better a way to directly plot these changes on a Smith chart. In short, it depends on how the component is placed in the circuit. If it’s added in series, it will increase the impedance. If it’s added in parallel it will decrease the impedance by the inverse of its value. Therefore, admittance is defined by Y = 1/Z. Admittance will make it possible to graphically move on the Smith chart when we’re adding parallel components, that’s why we need it.
The Smith Chart
The basic Smith chart is a plot of impedances with constant resistance (R) circles and constant reactance (X) arcs, both plotted from 0 to infinity. It’s a chart that we can plot our measured impedance onto. The normalized resistance value of 1 (reactance = 0) is at the center of the chart. By normalized, it means we divide all of our impedances by the system (or source) impedance. So, in our case the center normalized value represents a perfect 50-ohm resistance with 0-ohms reactance. Once normalized any measured impedance can be plotted on the chart. The center point (1) is going to be the target location that we want to match the load impedance to. This is where the source and load impedances are equal to each other; the VSWR is 1.
To move our load impedance to the center point we will be adding only inductors and capacitors, no resistors. We don’t want to dissipate power as heat by adding resistors, the inductors and capacitors will store and return the power to the circuit. As we add inductors and capacitors, we will be changing the reactance, the resistance does not change; it remains constant. This means we will be moving along the circles only (constant resistance circles). How can we get to the center if we are stuck on circles?
This is why we need to know about admittance. If we draw admittance lines (constant conductance circles and constant susceptance arcs) we see that we get another set of lines, except that 0 and infinity are swapped (everything is inverted). Combined charts are available, that already have both impedance and admittance lines plotted. It turns out that the plots are identical, except that they are rotated 180 degrees from each other. This makes perfect sense because the right side of the impedance chart is 0-ohms and the left is infinite ohms, and we know that Y = 1/Z. So, if you flip one around 180 degrees, you’ve got the other.
We need the admittance chart to add parallel components. This will allow us to add inductors and capacitors in parallel. In this case, we will be changing the susceptance (1/X reactance) as we move along constant conductance circles (1/R in this case). If you don’t have a combined Smith chart no worries, it can be done with just the impedance lines plotted, which is what I will describe here. Because they are the same plots, just rotated by 180 degrees, we can just replot impedance points to a rotated 180-degree location and then view the impedance chart as though it’s an admittance chart. You can then go back and forth using one chart for parallel components and series components simply by doing this. It’s not as difficult as it sounds. The procedure below will show you how.
Circuit Requirements
Design a circuit using inductors and capacitors to achieve the impedance match.
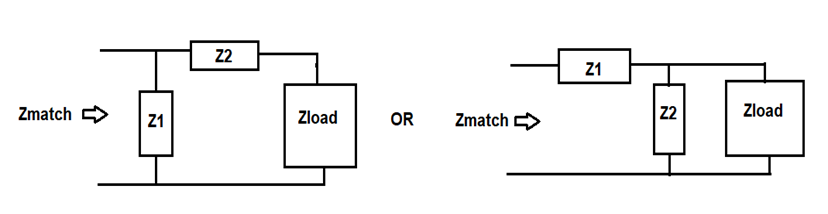
To cover all potential load impedances will require parallel and series components that will be arranged in one of two possible topologies.
Z2series topo Z2parallel topo
Determine if Z1 and Z2 are inductors or capacitors.
Determine the values of the components.
Procedure
Determine the Load impedance (Zload) at the Frequency (f) that you wish to match. I like using an inexpensive vector network analyzer, such as the nanoVNA for this.
Normalize Zload: We are working in a 50-ohm system, so we divide the values by 50 to normalize.
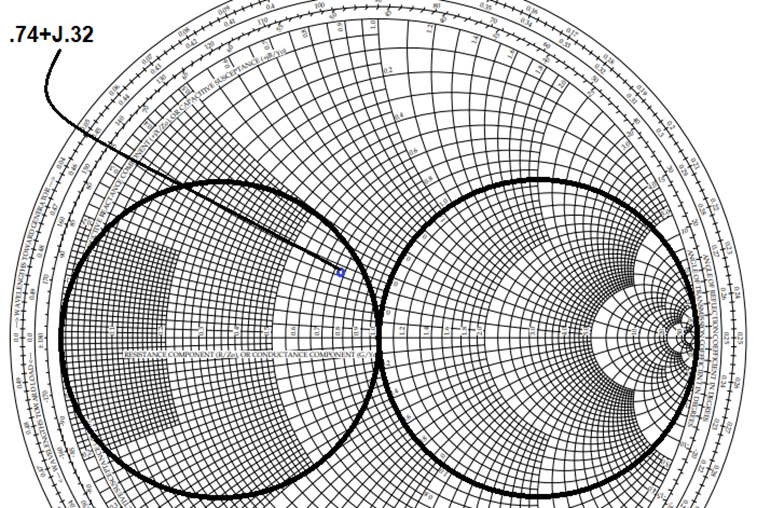
Example: Zload = 37/50 + j16/50 = .74 + j.32
Use the impedance Smith chart. Our goal is to plot our impedance as it is and then to add our matching components to move that impedance to the middle of the chart (1). As noted previously, It’s where the VSWR = 1 (50-ohm match). We are only adding inductors and capacitors, no resistors. This means that we will only be changing reactance, so resistance will stay constant. Therefore, our movement is confined to the constant resistance circle that we are on.
How can we get to the center (1) if we are stuck on a constant resistance circle? We can’t, so we add the admittance chart. We’ll get another set of circles and arcs that intersect the impedance circles and arcs. These circles will be constant conductance circles. You can use a combined Smith chart that shows both if you have one. For this procedure, I’ll proceed with the simple impedance only smith chart.
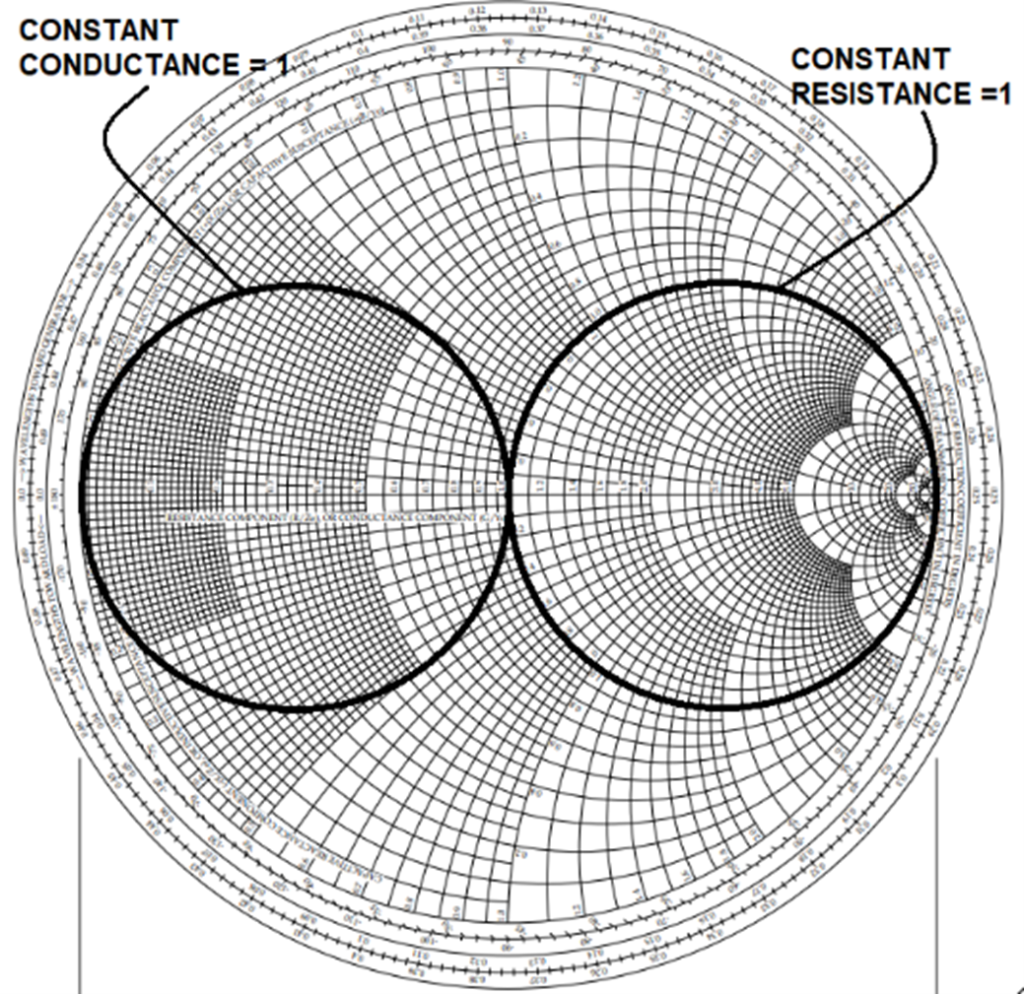
Continuing with the Impedance only chart, we need to add an important constant conductance = 1 circle. Let’s add that circle (see below) and lets also highlight the constant resistance = 1 circle.
We need these two circles for two reasons: 1. They will define which of the two topographies we will use (Z2series or Z2 parallel). 2. They will identify all points on the chart where the resistance and conductance are equal to our target of 1. (50 ohms). Since we can only move along circles, and we only want to add 2 components, when we add our first component, we want to move our impedance to a point on one of these circles. Then, we will only need to add one more component to move along one of these circles to the get to the center of the chart.
Plot the normalized Zload (.74_j.32) on the chart.
The .74 resistance is read along the center horizontal. The .32 reactance is read from the perimeter, where the arcs terminate.
Eventually, we want to move this impedance to the center point of the chart, but the first component we add must get us to a point on one of these two circles. We know that adding inductors and capacitors moves us along constant resistance or constant conductance circles. Looking at our plotted impedance, we see that we can move along a constant resistance circle to get to the constant conductance circle = 1. Let’s do that.
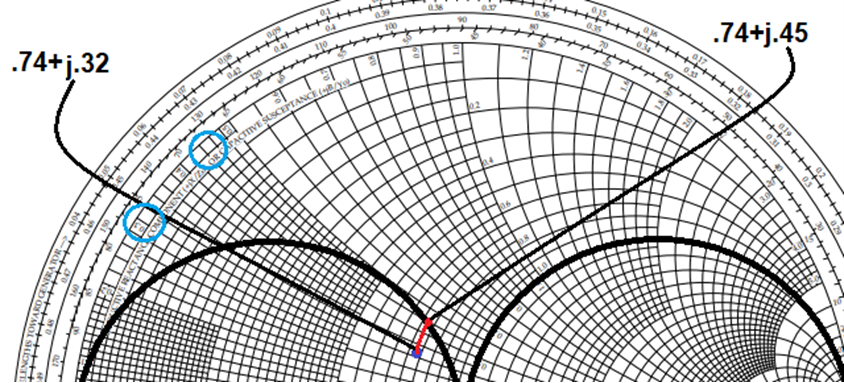
We moved along a constantresistancecircle from .74+j.32 to .74+j.45, therefore, we have added .13 reactance in series with the load. This means that we must use the Z2series topology. Notice that for any impedance we start with that lies inside the constant conductance circle we MUST use the Z2series topology because the only circles that intersect the conductance =1 circle are constant resistance circles. The opposite holds true for the constant resistance circle. If we are inside the constant resistance circle, we MUST use the Z2parallel topology. What if we are outside these two circles? In that case, you get a choice, either topology can be made to work.
What else did we already determine? We added .13 reactance. Anytime we ADDreactance we are adding an inductor. So, the series componentis an inductor. Notice that we could have moved in a negative j direction and reached the bottom edge of the circle. In this case we would be subtracting reactance. Anytime we SUBTRACT reactance we are adding a capacitor. It’s your choice. Back to our inductor, we also know the value of the inductor by the amount of reactance (.13) that we added. We’ll figure that out at later.
We are now on the admittance circle =1, and it goes right thru the center point (1). This is good, we can move along this circle with one more component to get to the center. When we move along a constant conductance circle, we are adding a component in parallel.
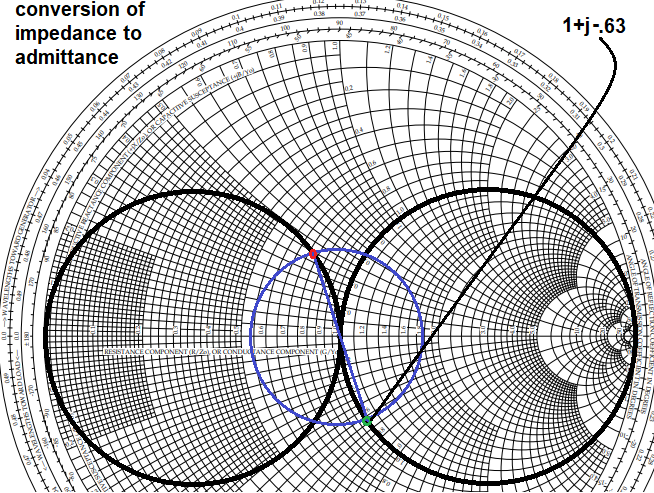
If you have a combined Admittance/Impedance Smith chart: You can now move toward the center along this circle, noting that you will move -j.63. Moving in a negative j direction is subtracting susceptance. Thismeans that this component is a capacitor. And, since this is a susceptance value (B=1/X) we need to invert it to find the reactance X= 1/.63 = 1.59.
If you only have an impedance Smith chart: Notice that if we move along the constant conductance = 1 circle there aren’t any arcs that go to the perimeter where we can read the change in reactance. However, since we know that the admittance chart is the same as the impedance chart except that it is rotated 180 degrees, we can replot our impedance to a location 180 degrees around the chart. We will then use the impedance Smith chart (with labeled arcs) as though it is an admittance Smith chart. We will have to remember though that we effectively rotated our chart 180 degrees. Up is now down and down is up. So, moving in the negative j direction is really moving positive and vice versa. We will have to remember this since the + or – sign of our direction movement determines if it’s a capacitor or an inductor that we adding.
To do this: Replot the impedance 180 degrees around the chart: Draw a circle, centered at the center of the chart with the radius set to the impedance. Next draw a line from the plotted impedance thru the center to the opposite side of the same circle.
From this point we can now use the constant resistance=1 circle to get to the center point. We now have j values at the perimeter that we can use. We see that we are going to have to move +j.6 to get to the center. But remember, the chart has been spun 180 degrees. Therefore, we are really moving -j.63 not +j.63. So, we are adding a capacitor (- movement) not an inductor (+ movement). Again, we are working in the admittance domain, just using the impedance chart so we can read values from the perimeter. Therefore, the component is to be added in parallel and, we must invert the susceptance value (B) to find the reactance (X=1/B) of the component we are adding. Therefore X = 1/.63 =1.59.
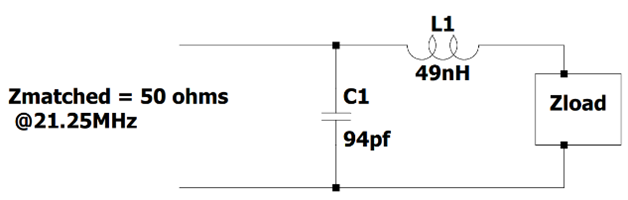
Knowing the impedance, we can calculate the values for the Inductor and Capacitor.
The components we select must also be capable of handling the currents and voltages that will be present. You must meet the maximum voltage spec for the capacitor and the maximum current spec for the inductor. If you don’t the components could be damaged, or even cause a fire hazard. For this example, our Transmitter can deliver 100 watts of power. Power is calculated using RMS values, so the RMS voltages and currents can be calculated by these formulas; P=I2*R and P=I*V, if we know the resistance. The Transmitter is designed to operate in a 50-ohm system. Using the equations, we calculate; Vrms=70.7 volts, Irms=1.414 amps. The component ratings are in peak voltages, so we need to convert the rms values to peak values. Divide by .707 to get the peak values. The peak voltages and currents are then V=100 volts, and I = 2 amps. We could see 2X’s these values due to reflections when we are not matched. That gets us up to V=200V and I=4A. For capacitors the rule of thumb is to use a capacitor with a voltage rating of 2X the voltage, so a minimum capacitor rating of 400V would suffice. It’s easy to find inexpensive capacitors rated to 500V and into the thousands. I like to wind my own inductors, so I would use magnet wire that can handle at least the 4A. #22 wire is rated to 7A for chassis wiring. This is a non-bundled spec. Depending on the inductance our windings could become fairly dense, so take care for large values of inductance. I would expect #22 to be fine for most inductors being designed for this application. Anyway, I have been using #20 wire rated to 11A chassis and #18 wire rated to 16A chassis without any issues.
October 21, the LRRA held their Annual Meeting at 4:30 PM in the old Lions Club Function Hall in Moultonborough on Old Route 109.
Elections where held for President, Vice President, Secretary, and Treasurer. Because all four incumbents have expressed the willingness to continue for another term, a nominating committee was not convened. An election still is required, however.
To see the official documents please see this page.