RF coverage maps: to expand map image right click and open in new tab.
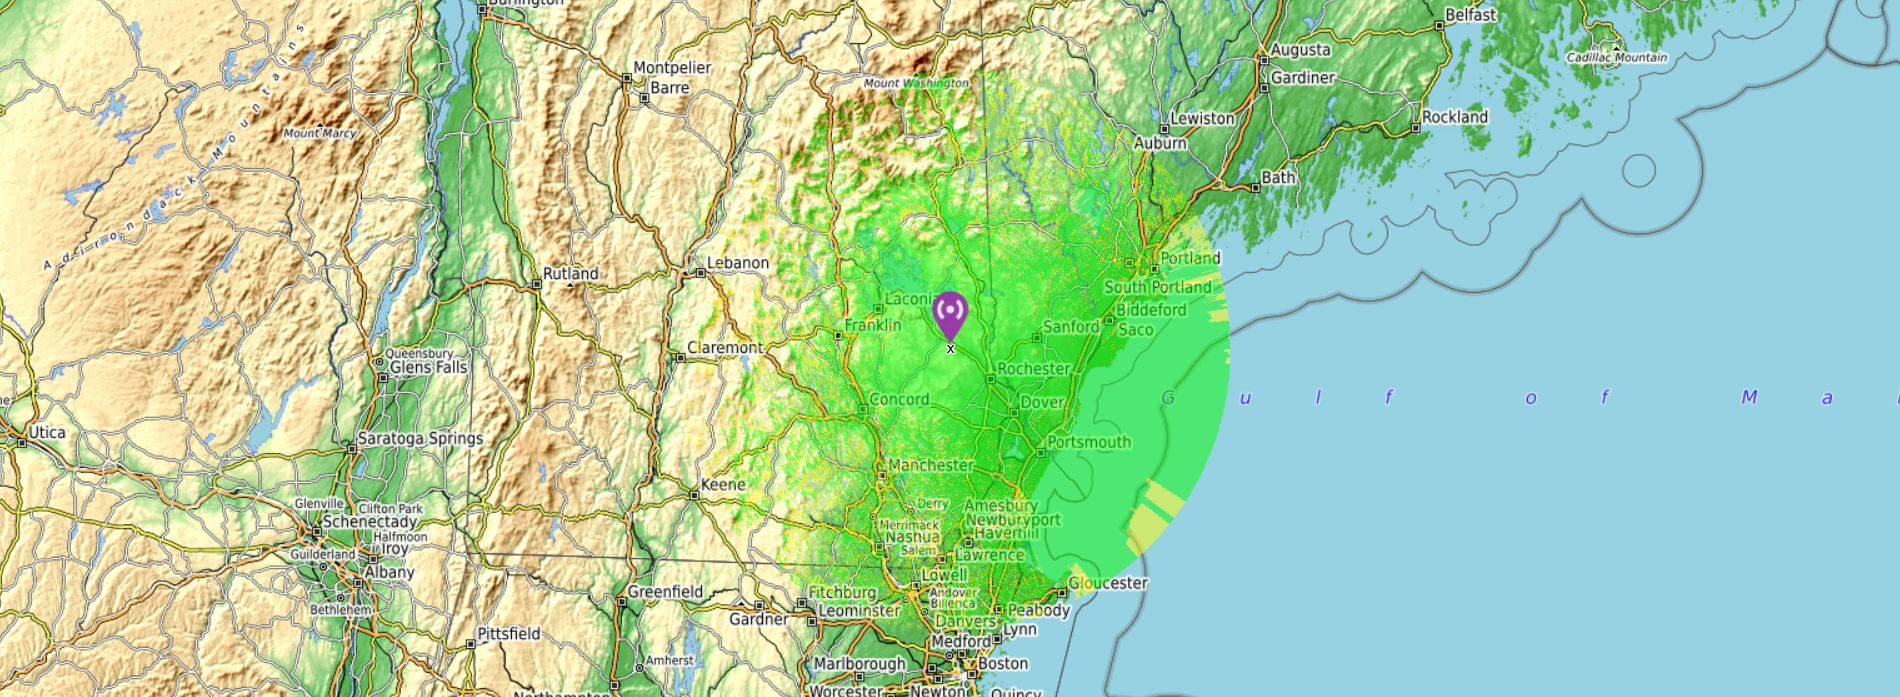
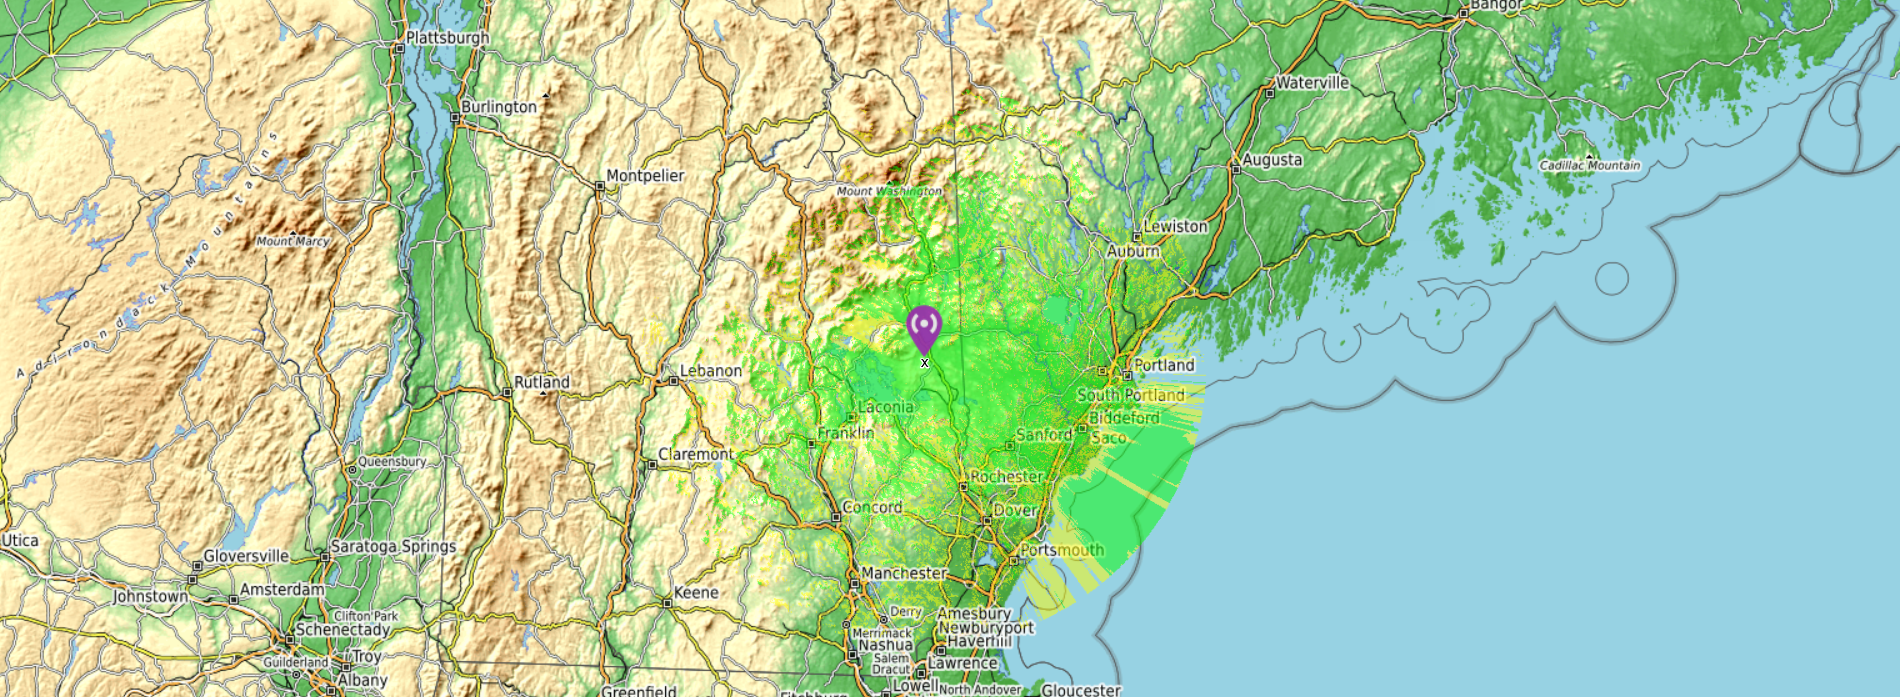
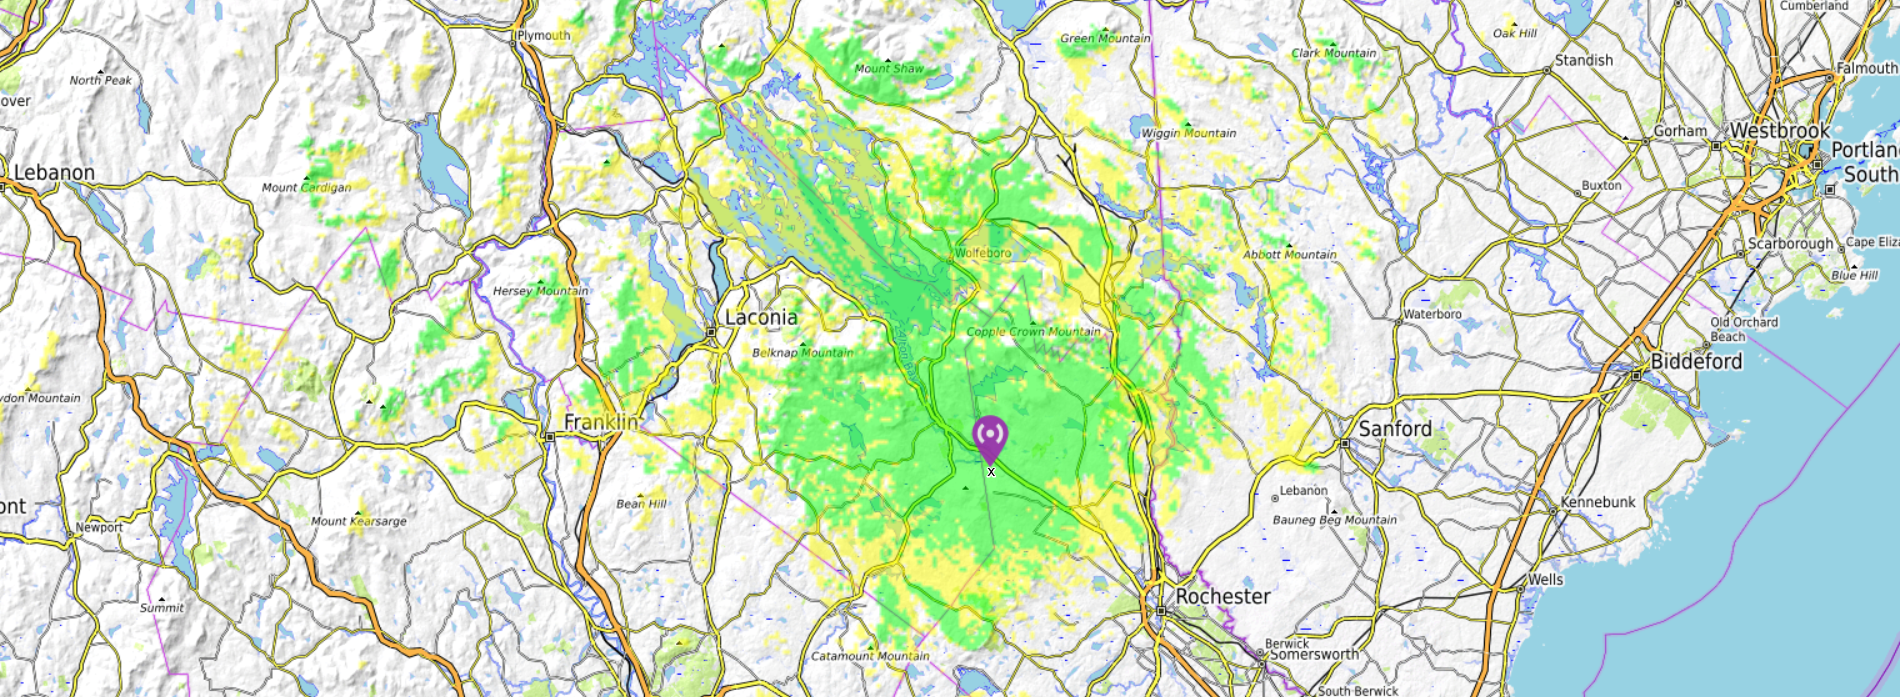
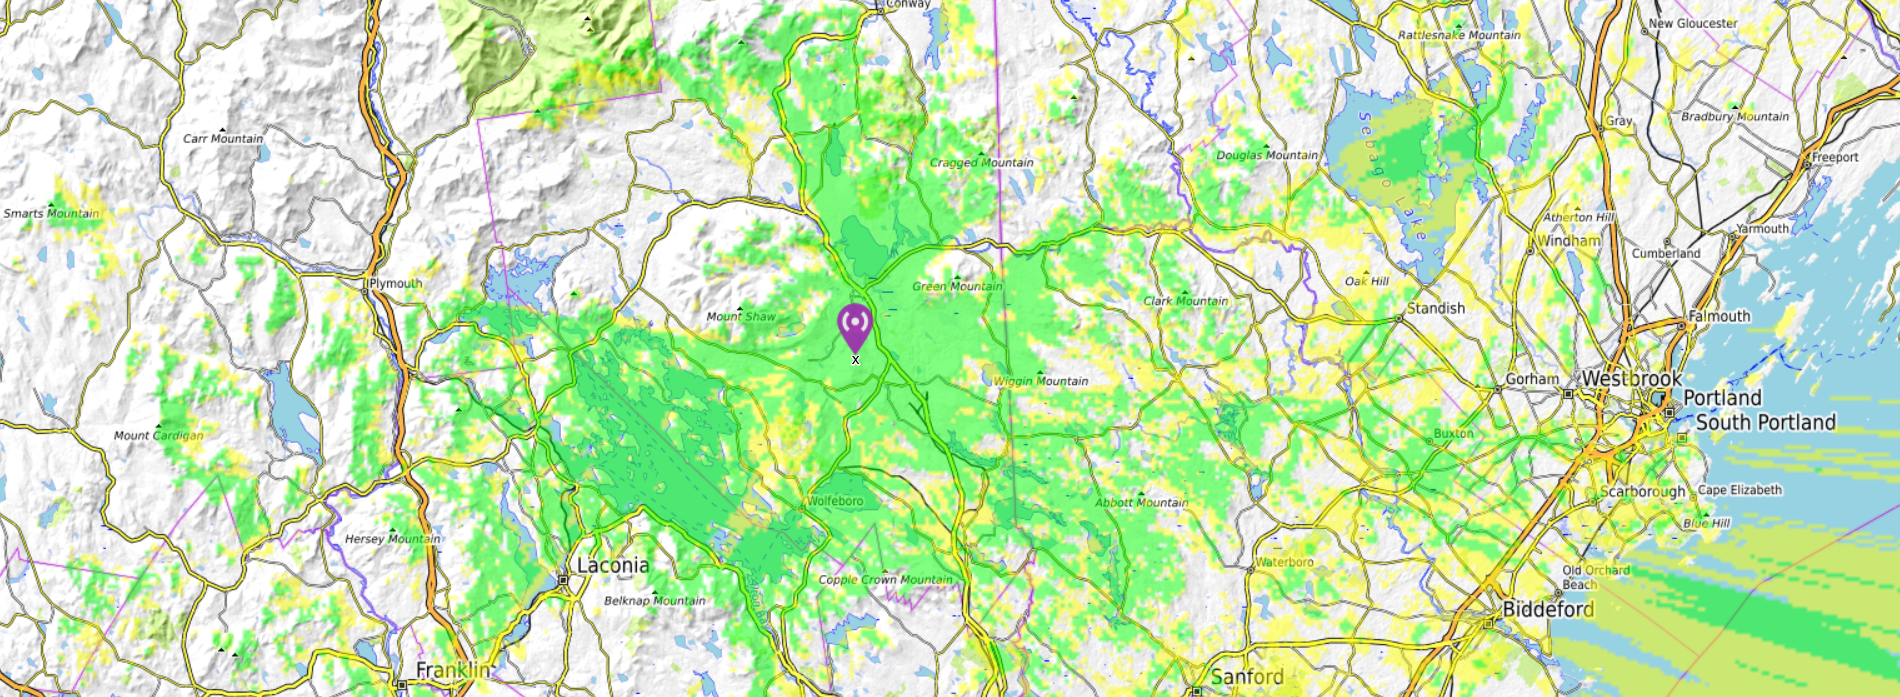
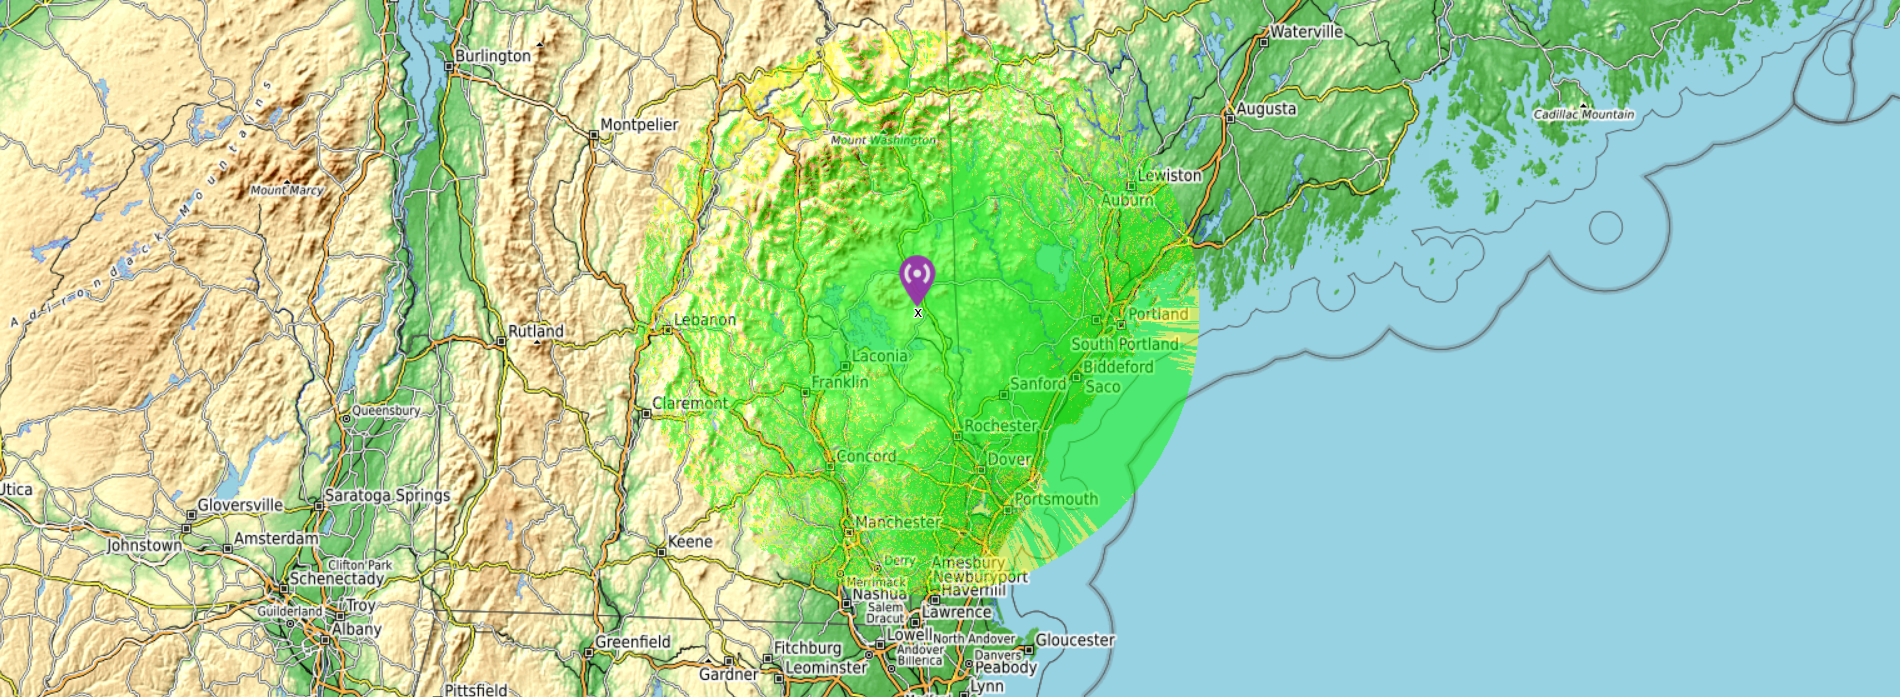
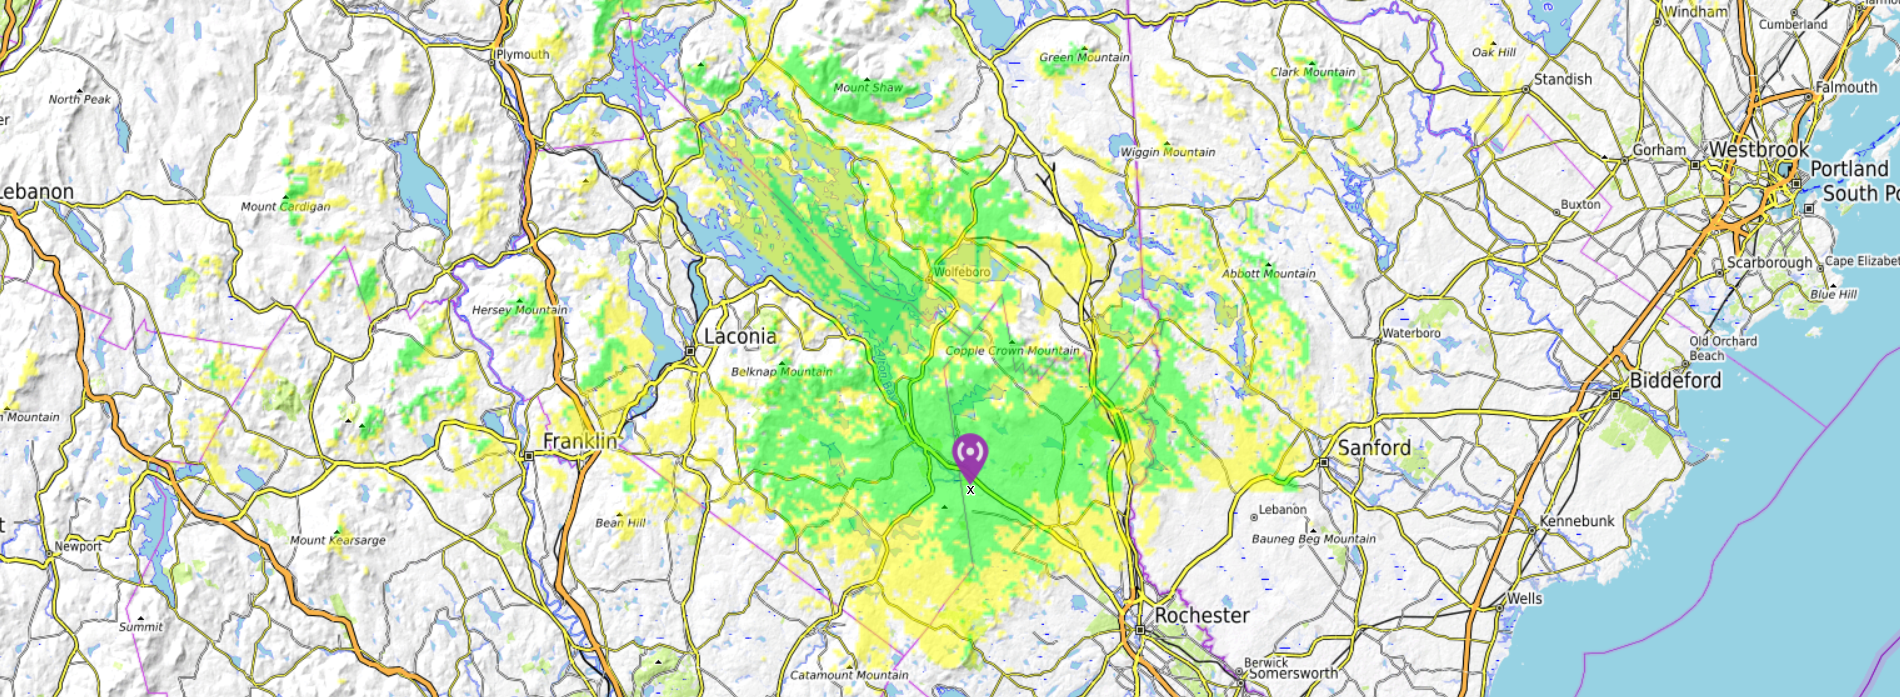
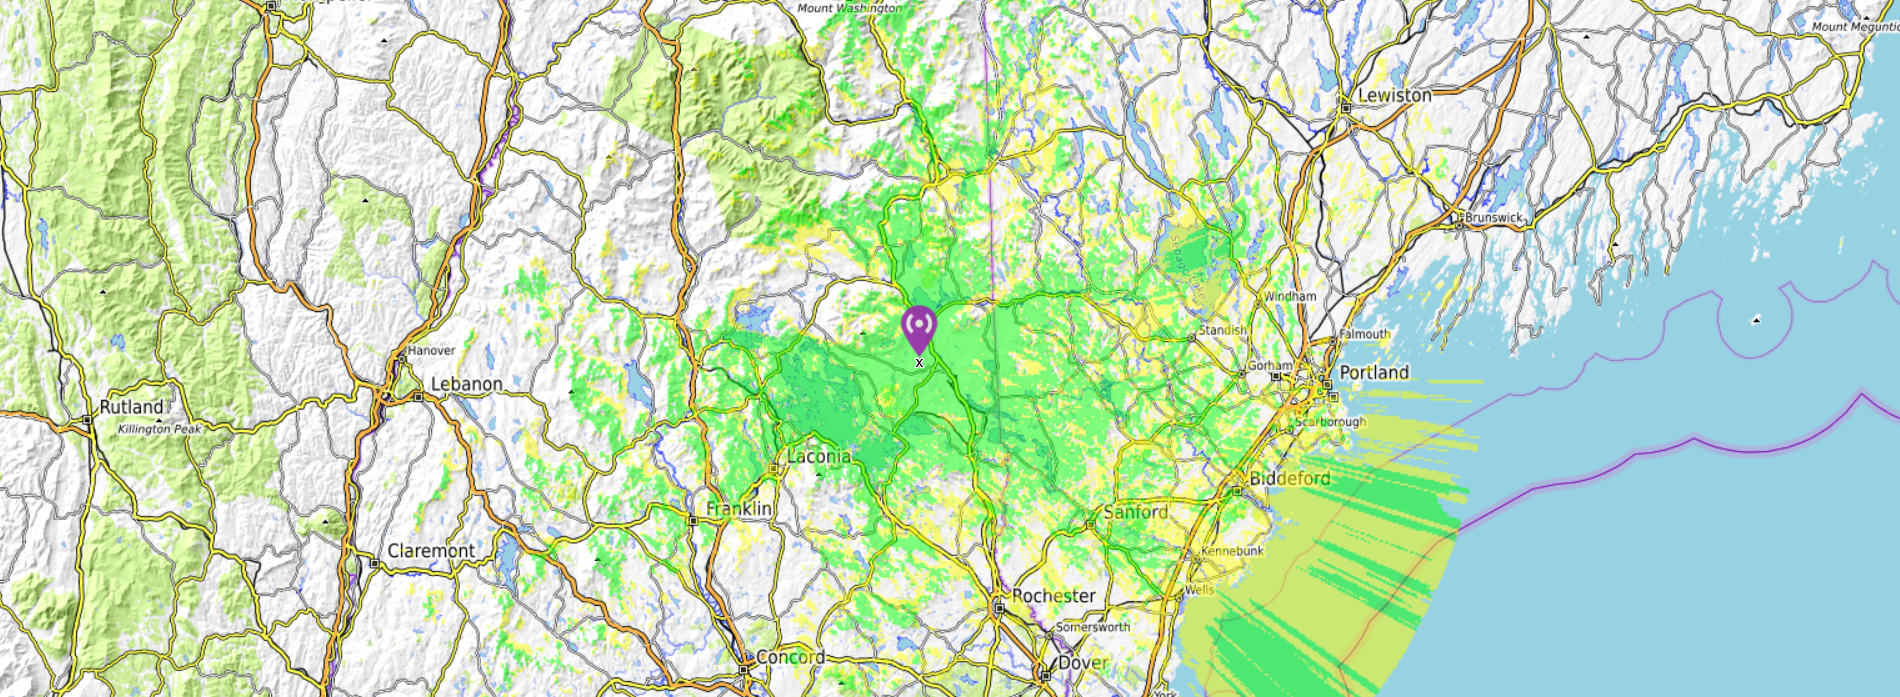
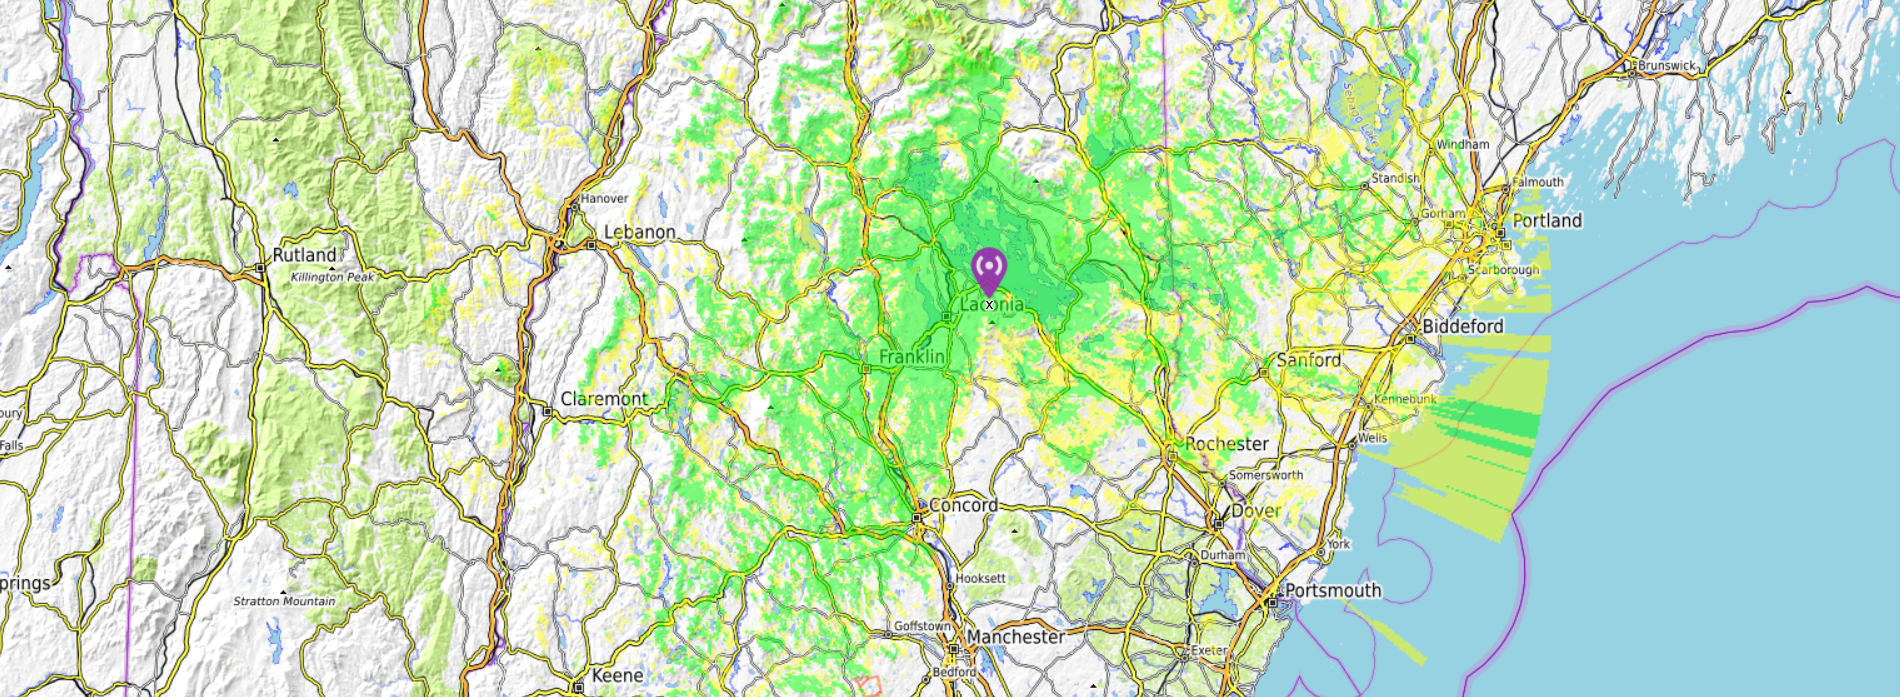
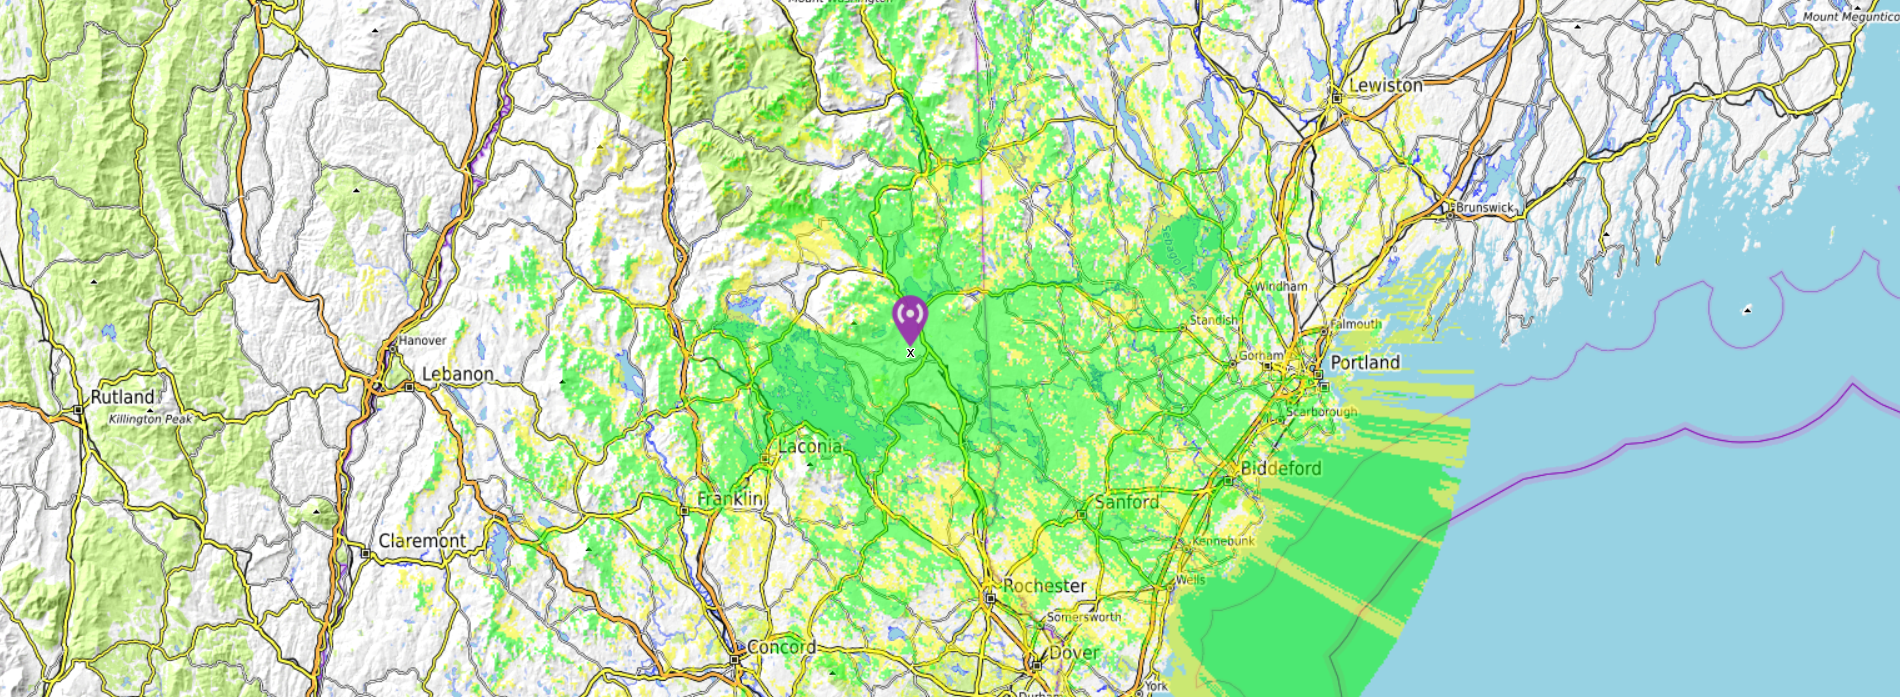
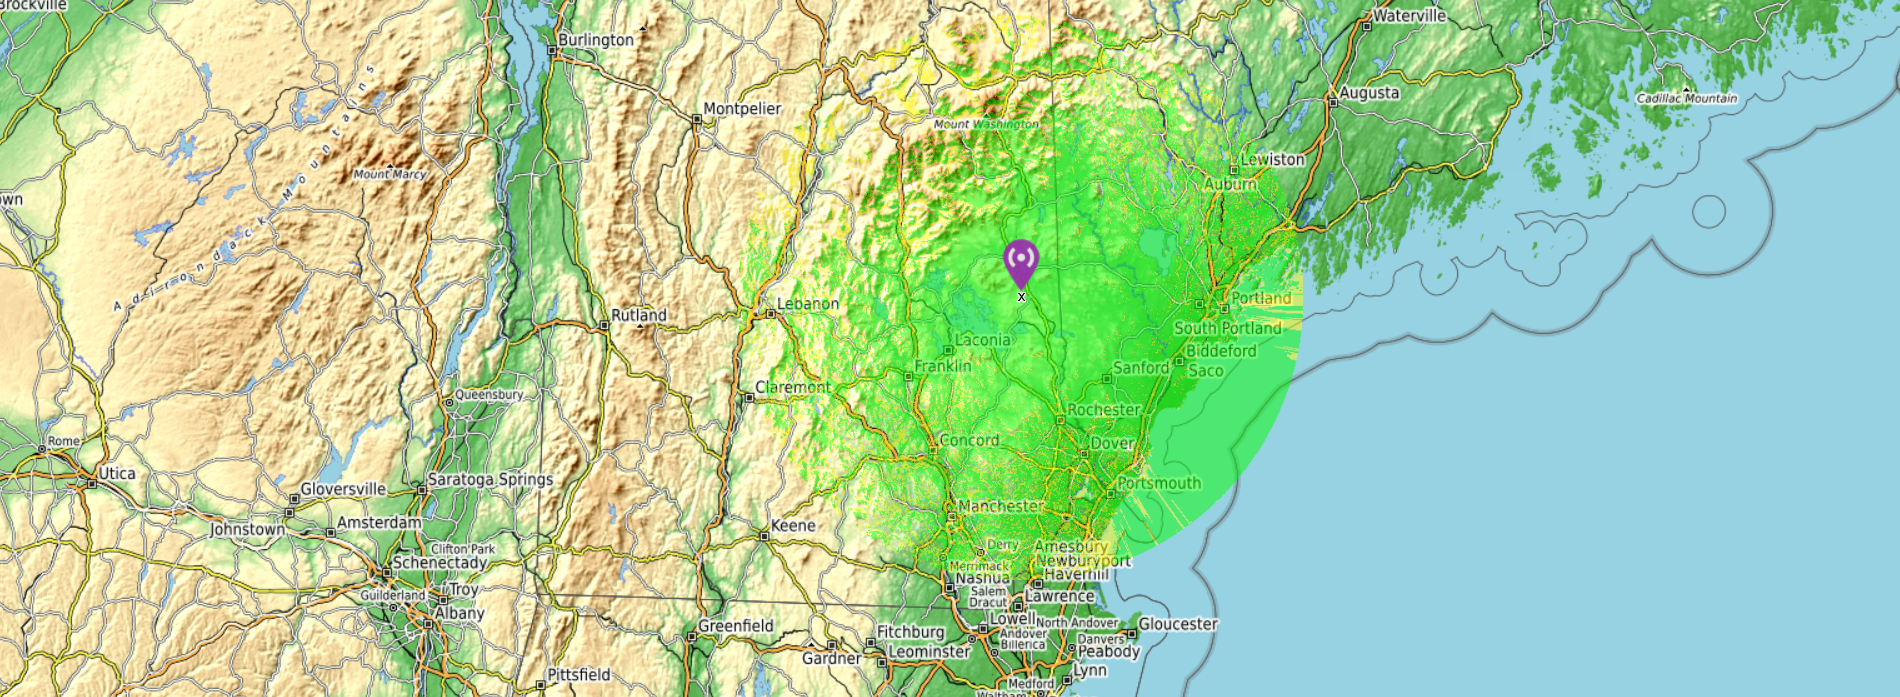
- Local Coverage: Within this area, you should be able to receive the radio station on almost any radio with moderately good to very good reception.
- Distant Coverage: Within this area, the signal of the ham radio station may be weak unless you have a good antenna. You may not be able to receive the station at all with poor antennas.
- Fringe Coverage: Within this area, the station’s signal will be very weak. You may be able to receive this station if you have a very good radio with a good antenna, but it’s possible that interference from other stations may prevent you from picking up these stations at all.
- RF coverage maps are designed to indicate the service areas of radiocommunication transmitting stations. Typically these may be produced for radio or television stations, for mobile telephone networks and for satellite networks. Such maps are alternatively known as propagation maps.
-
Data fields used to create RF coverage maps
Centre Site – this is the location of your transmitter. Select your location using the pull down menu.
Antenna Height – this is the height of your antenna above the ground at that specific location. Please note that this is in metres and if you want to convert your height in feet, divide the value by 3.2808 (i.e. 100 ft = 30.48 m).
Antenna Type – this is the type of antenna that you will be using at the transmitter location. Unless you’ll be using an antenna with an offset gain, you should just use the default omnidirectional, or “Omni” setting.
Antenna Azimuth – this is the direction that your antenna will be pointing, with 0° being north. This value is only important if you are using an antenna with an offset gain value, as it would not have any impact for an omnidirectional antenna.
Antenna Tilt – this is the angle of radiation of your antenna with 0° point towards the horizon. Some antennas have a higher gain value point slightly upwards or downwards, so this setting can be used to address this.
Antenna Gain – this is the amount of gain for your specific antenna. To find out the gain value for your antenna, you may need to check the specifications that are published for it by the manufacturer. Please note that the value for this field is in dBi (isotropic) – if your antenna has a dBd (dipole) value, you can covert dBd to dBi by adding 2.15 dBi (i.e. 5 dBd = 7.15 dBi).
Mobile Antenna Height – this is the height of the receiving antenna on the mobile station that will be used to determine your coverage area. Again, please note that this is in metres and if you want to convert your height in feet, divide the value by 3.2808 (i.e. 10 ft = 3.48 m).
Mobile Antenna Gain – this is the gain of the receiving antenna on the mobile station that will be used to determine your coverage area. Please note that the value for this field is in dBi (isotropic) – if your antenna has a dBd (dipole) value, you can covert dBd to dBi by adding 2.15 dBi (i.e. 5 dBd = 7.15 dBi).
Frequency – this is the frequency that your transmitter will use. Radio Mobile Online allows frequencies to be used within amateur radio bands from 10 MHz to 250 GHz.
TX Power – this is the power output of your transmitter in Watts.
TX Line Loss – this is the power loss in your feed line cable between the transmitter and antenna at your transmitter location. The longer the feed line, the higher this value will be. To find the value, you should check with the cable manufactures specification for your feed line and calculate the total loss based upon the length of your cable. For added precision, you can also include the power loss in your connectors as well.
RX Line Loss – this is the signal loss of the feed line for your receiving station in dBi.
RX Threshold – this is the lowest signal level that the coverage map will display. While most radios have better receive sensitivity than this, this value will provide a good indication for coverage for all radios, including older one with less sensitive receivers.
Required Reliability – this figure displays the reliability to which the coverage is likely to experience. For more accurate coverage maps, you can increase this value, however the resulting coverage area will less.
Maximum Range – this value defines the limit of the coverage analysis. If you expect coverage beyond 100 km, then increase this value to show coverage beyond 100 km. Please note that if you want to convert from miles to kms, multiply by 1.6 (i.e. 100 mi = 160 km).